Co-brand Partnerships

award-5.gif (6517 bytes)
Vote for Us

topsite.gif (1668 bytes)

webfifty.gif (6027 bytes)


drop_center.gif (2753 bytes)


wpe1.jpg (2095 bytes)


FREE EMAIL
Email Login
Password
New Users Sign Up!
 
NEWS SEARCH
WEB DIRECTORY
WEB SEARCH
 CITY GUIDES
search by:
 WEATHER

Current Weather
Enter Your City, State, or Zipcode:


MASTERING
THE TRADE

ORIGINAL, INTERACTIVE SEMINAR ON TRADING USING
TECHNICAL ANALYSIS


EARNINGS ESTIMATES

Enter Symbol

U.S. QUOTES

Enter Symbol:

U.S. CHARTS

Enter Symbol:

TECHNICAL OPINION

Enter Symbol:

CANADIAN CHARTS

Enter Symbol


 SEC FILINGS

Search For:
 

Company Name
Ticker Symbol

 BROKER RESEARCH
Exclusive Broker

Research
Enter Ticker


ARCHIVE:    JUNE 1999-JULY 2000  

An InvestorLinks article
distributed every market day.

Phone.com  (NASDAQ: PHCM)
Market Call™ for August 2, 2000
Contributed by Mark Seleznov, TrendTrader.com.

The purpose of this Market Call section is to educate readers in technical analysis patterns and indicators. As with all investment information, you need to research information and consult your financial advisor before initiating any strategies that are contained in Market Call.

Also, you must realize that as with all trading strategies, opinions can change quickly depending on market conditions and developments.

This column tries to present historical examples, potential set ups, and examples of entry and exit strategies.

The past three days have seen many stocks consolidate at these lower levels.

The S&P stocks continued a bounce from oversold areas, but the NASDAQ is retraced back into a trading range. I feel that there is a greater chance of a up move from these oversold levels.

Consolidation Patterns

The market value of a stock is a determined by pure supply and demand battles between Bulls and Bears. This supply and demand is constantly changing on a minute by minute basis. There are probably hundreds of both rational and some irrational factors that play into a stock movement. I believe that stocks move in trends that can last for a long time. During these major trends, minor counter trends do develop and the trader tries to take advantage of movement both to the up and down on stocks. It is also very common to see stocks trade in a range until supply or demand factors resolve themselves. It is moves from these consolidation areas that present some of the best trading opportunities. These consolidation patterns can take the shape of rectangles, symmetrical triangles, ascending triangles, descending triangles, flags, double tops or bottoms and even triple tops and bottoms, head and should formations and rounding tops or bottoms. It sometimes amazes me how the stock market follows the same crowd behavior and keeps repeating these patterns over and over again. The basic nature of the markets fear and greed exhibits itself everyday. Let’s examine one of these formations.

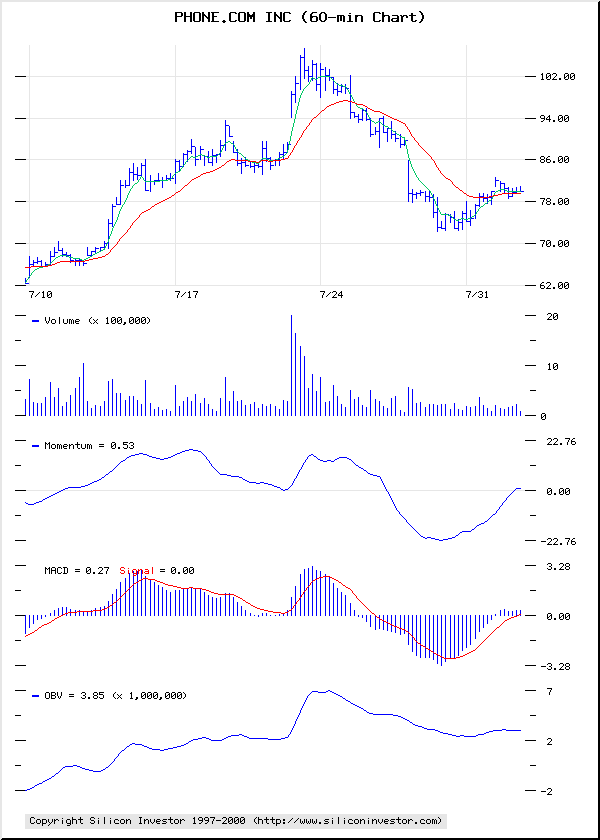
Let’s look at a Head and Shoulder formation in Phone.com (NASDAQ: PHCM).

A Reverse Head and Shoulder. A reverse Head and Shoulder is a Bullish pattern.

The Head and Shoulders Pattern

The head and shoulders pattern is generally regarded as a reversal pattern and it is most often seen in uptrends. It is also most reliable when found in an uptrend as well. Eventually, the market begins to slow down and the forces of supply and demand are generally considered in balance. Sellers come in at the highs (left shoulder) and the downside is probed (beginning neckline.) Buyers soon return to the market and ultimately push through to new highs (head.) However, the new highs are quickly turned back and the downside is tested again (continuing neckline.) Tentative buying re-emerges and the market rallies once more, but fails to take out the previous high. (This last top is considered the right shoulder.) Buying dries up and the market tests the downside yet again. Your trendline for this pattern should be drawn from the beginning neckline to the continuing neckline. (Volume has a greater importance in the head and shoulders pattern in comparison to other patterns. Volume generally follows the price higher on the left shoulder. However, the head is formed on diminished volume indicating the buyers aren't as aggressive as they once were. And on the last rallying attempt-the left shoulder-volume is even lighter than on the head, signaling that the buyers may have exhausted themselves.) New selling comes in and previous buyers get out. The pattern is complete when the market breaks the neckline. (Volume should increase on the breakout.)

This pattern can be used on charts of various time frames from minutes to daily or even weekly charts. Our charts are 60 minute charts. Let’s look at reverse Head and Shoulder.

Head and Shoulders Pattern:

A major reversal pattern with four distinct features:

Left Shoulder:

A consolidation period followed by a minor reaction with significantly less volume than during the drop to the bottom. This is the period July 27 after the open.

Head:

A higher volume failure with the bottom reaching a lower level than the left shoulder. This time frame is July 28.

Right Shoulder:

A third rally up to the left shoulder. This is the July 31 and today’s action of August 1.

Neckline:

The neckline in a reverse Head and Shoulder is drawn across the left and right shoulders. The neckline would be at 82 5/8.

If and only if PHCM breaks the neckline and moves up above 82 � would complete a reverse Head and Shoulders formation.

I would Buy PHCM at 82 � on a Buy stop. I would place a stop at 80 if filled.

Do not take the trade if the stock does not trade above this neckline.

Chart courtesy of


Interested in adding Market Call to your website?
Click here for details: Market Call Information

Mark A. Seleznov is a General Securities Principal and Managing Partner of Trend Trader, LLC, a NASD, SIPC broker/dealer firm located in Scottsdale, Arizona. A professional trader for over 25 years, Mark was a Market Maker on the Philadelphia Stock Exchange, a Retail Registered Representative, and futures trader. Mark is an author and recognized expert in equity Day Trading. He conducts seminars in Equity Day Trading and offers his firm traders training and support. If his firm holds any positions in the public companies he writes about, it will be noted at the bottom of his article.

Market Calls is a daily syndicated column on trading by Mark A. Seleznov, Managing Partner of Trend Trader, LLC. For information on obtaining Market Calls for your web site, newspapers, or publication, contact
Trend Trader, LLC at 602-948-1146

Disclaimer: Trading in securities may not be suitable for all individuals. Consult your broker or other professional to determine your suitability. This is not an offer to buy or sell securities. The advice given above is of a general nature and should not be taken as a recommendation to buy or sell the referenced security.

 
Search for it at the TulipSearch Open Directory
Investment Bookstore Investment Newsstand Market Mavens Report

TULIPS AND BEARS NETWORK SITES


FINANCE
Tulips and Bears
Contrarian Investing.com
Internet Stock Talk
Traders Message Boards
Traders Press Bookstore

NEWS AND INFORMATION
TulipsWeather
Freewarestop.com
TulipsMail
TulipsEspa�ol
TulipSearch
TulipNews
TulipCards
AllMusicSearch.com
City Guides
Travel Center
Bargain Bloodhound...coming soon

WEBMASTER TOOLS

TulipHost
BecomeAnAffiliate.com
TulipDomains
GoSurfTo
TulipStats
...coming soon
TulipTools...coming soon

Questions or Comments? Contact Us

Copyright � 1998-2000 Tulips and Bears LLC.
All Rights Reserved.  Republication of this material,
including posting to message boards or news groups,
without the prior written consent of Tulips and Bears LLC
is strictly prohibited.


Last modified: March 17, 2001

Published By Tulips and Bears LLC